Target Population and Samples
The foundation of the Innovation Survey established in 2009 with the sample I as a new household sample was initially introduced as a “methodology sample” within the SOEP-Core Samples. At the end of the first survey wave the sample consisted of 1,531 participating households. The basic methodical design of this sample was largely in line with the SOEP standard for top-up samples. The sampling procedure was based on the so-called Random-Route procedure with household identification and household interviewing in separate steps (address random). The mode of conduct in the first survey was limited to CAPI (Computer Assisted Personal Interview), opening to PAPI (Paper and Pencil Interview) in wave 2. The used survey instruments were similar to the SOEP-Core Samples with minor exceptions. However, sample I has undergone different survey innovations and tests from its very beginning. Examples include the onomastic (name-based) screening methods for oversampling immigrant households as well as experimental testing of various levels and types of incentives. The test shape of the study was upheld for following Innovation Survey top-ups, all characterised by a number of innovative survey questions. As mentioned earlier, the Innovations Survey’s units of interest are households. However, it is important to point out that the innovation modules run almost exclusively on personal level.
The target population covered in the SOEP is defined as the population of private households residing within the current boundaries of the Federal Republic of Germany (FRG).
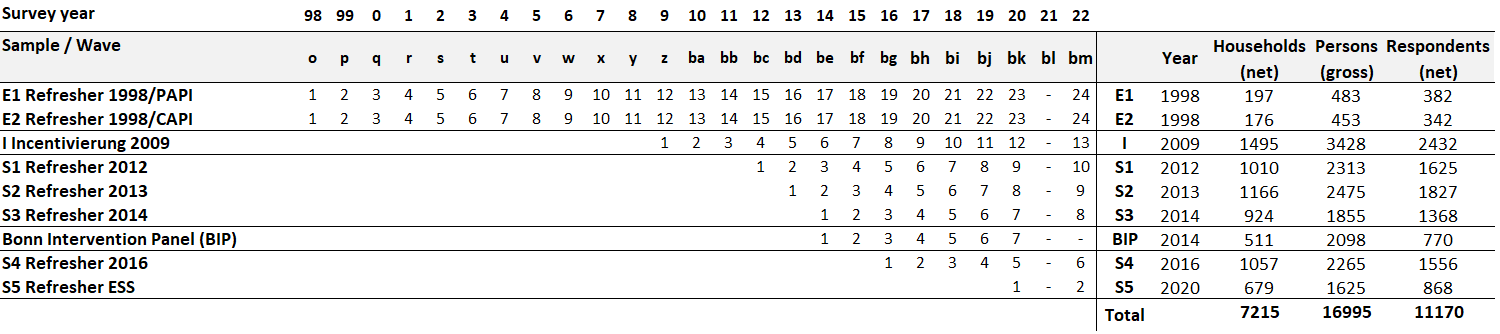
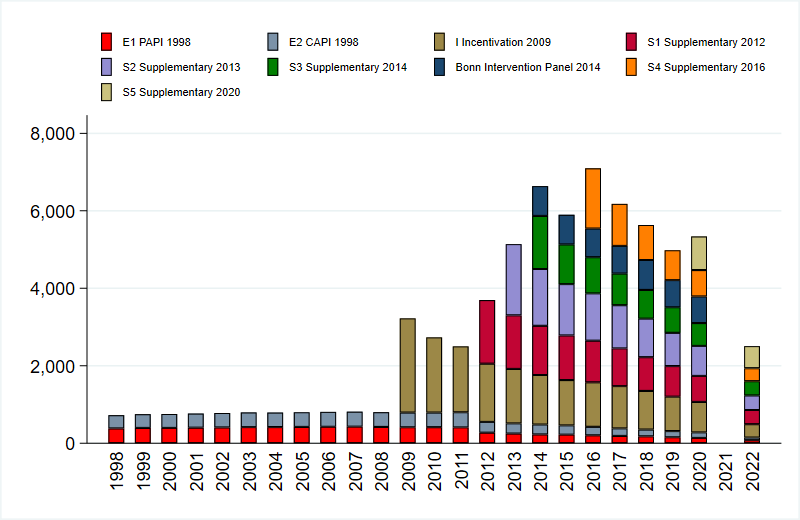
Individuals who decline to take part in the survey or are not available for an interview are kept in the so-called “gross” sample of the study as long as they continue to live in households with at least one participating respondent. If the entire household declines to participate in two consecutive waves, all individuals in the household are removed from the SOEP. The follwing table shows the starting sample sizes of the SOEP-IS samples and the years in which they were surveyed. Please note that the samples get smaller every year due to panel mortality. Although new respondents are gained, for example, when people move into a SOEP household or when children turn 18, this is not enough to compensate for the dropouts. For this reason, new samples are drawn to refresh the total sample. The second graphic shows the number of respondent per survey year.
Starting Sample Size of the SOEP-IS Samples
Cross-Sectional Development of Sample Size (Respondents)
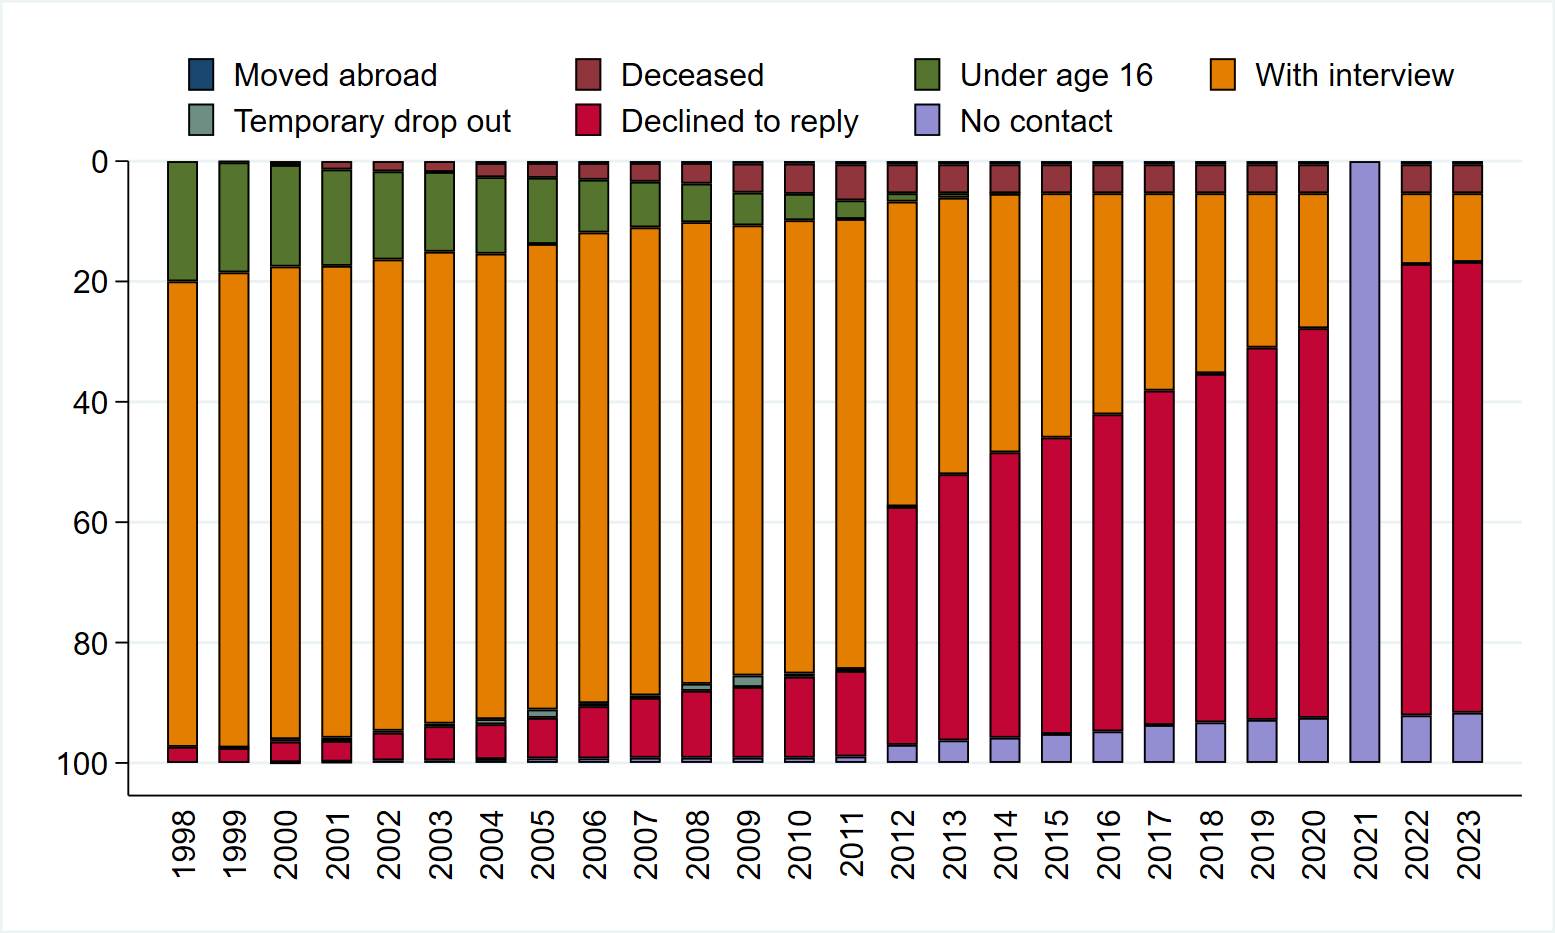
Longitudinal Development of the 1998 Population
Waves and results
The following table provides an overview of the gross and net sample sizes for the various years of the SOEP-IS survey, as well as the respective response rates. While the absolute figures are reported at both the household and individual levels, the response rate is provided only at the household level, since the SOEP-IS is a household panel and this represents the relevant metric for assessing the response rate. This table also includes waves from the years before 2011, as the first SOEP-IS samples were originally drawn as part of SOEP-Core. Please mind, that the respective sample sizes of these years only include households and individuals, that later became part of SOEP-IS. Therefore, the data from these years should only be interpreted within the context of SOEP-IS. You will also find the projected figures for the coming years. Please note that these are only preliminary estimates and may change significantly even short-term.
Figures have been rounded down to the nearest 100.
Year |
Gross Sample (households) |
Gross Sample (individuals) |
Net Sample (households) |
Net Sample (individuals) |
Responserate (valid households) |
Note |
|---|---|---|---|---|---|---|
1998 |
~300 |
~700 |
In this year, the first sample was drawn, which later became part of SOEP-IS |
|||
2009 |
~1900 |
~3200 |
In this year, another sample was drawn, which later became part of SOEP-IS |
|||
2010 |
~1600 |
~2700 |
Last year in which the later SOEP-IS samples were part of SOEP-Core |
|||
2011 |
~1800 |
~4000 |
~1500 |
~2500 |
~81% |
First year of SOEP-IS as separate study |
2012 |
~4600 |
~5800 |
~2200 |
~3600 |
~46% |
|
2013 |
~6900 |
~7900 |
~3100 |
~5100 |
~44% |
|
2014 |
~7700 |
~11200 |
~4200 |
~6600 |
~53% |
|
2015 |
~4500 |
~10500 |
~3700 |
~5800 |
~80% |
|
2016 |
~8600 |
~11600 |
~4500 |
~7000 |
~51% |
|
2017 |
~4800 |
~11000 |
~4000 |
~6100 |
~81% |
|
2018 |
~4400 |
~10000 |
~3700 |
~5600 |
~82% |
|
2019 |
~4000 |
~9000 |
~3300 |
~4900 |
~80% |
|
2020 |
~4600 |
~9800 |
~3700 |
~5300 |
~78% |
|
2021 |
N/A |
N/A |
N/A |
N/A |
No survey was conducted in 2021 |
|
2022 |
~3600 |
~7500 |
~1800 |
~2500 |
~49% |
This year, infas was the survey institute of SOEP-IS for the first time |
2023 |
~13100 |
~12100 |
~3500 |
~4700 |
~26% |
|
2024 |
~4600 |
~10100 |
~2700 |
~3700 |
~57% |
|
2025e |
~18400 |
~15300 |
~4800 |
~6700 |
~26% |
Estimated values. The actual figures and results may may differ |
2026e |
~7500 |
~13600 |
~4100 |
~5600 |
~54% |
Estimated values. The actual figures and results may may differ |
2027e |
~6600 |
~12200 |
~3600 |
~5000 |
~53% |
Estimated values. The actual figures and results may may differ |
2028e |
~6000 |
~11200 |
~3200 |
~4500 |
~52% |
Estimated values. The actual figures and results may may differ |